
Affiliate Disclosure
Some links on this page are affiliate links. As an Amazon Associate, we earn from qualifying purchases — at no extra cost to you. We do not buy, test, or physically handle the products we cover; our rankings come from aggregated owner reviews, ratings and expert consensus. Commissions never change our verdicts. How we rank & full disclosure.
You pulled a fault code, cleared it, and the check engine light came back three days later. Sound familiar? That loop ends the moment you stop looking at codes alone and start reading the story behind them. OBD2 freeze frame and live data give you that story — the exact conditions when a fault triggered, and a real-time window into every sensor your engine relies on. This guide breaks down what both features mean, which PIDs actually matter, and how to use them to close in on a real diagnosis.
What Is Freeze Frame Data?
When your ECU decides a fault is serious enough to store a DTC, it simultaneously takes a snapshot of a handful of operating parameters at that exact moment. That snapshot is freeze frame data. Think of it as the black box recording from the moment something went wrong.
Every OBD2-compliant vehicle (1996 and later in the U.S.) is required to store at least one freeze frame record per confirmed fault. The parameters captured typically include:
- Engine RPM — Was the engine at idle, light cruise, or under hard acceleration?
- Engine load (%) — How much of available power was being demanded at fault time?
- Coolant temperature (°C / °F) — Was the engine fully warmed up or still in open-loop warm-up mode?
- Vehicle speed — Stationary, low-speed urban, or highway?
- Short-term and long-term fuel trims (STFT / LTFT) — Was the ECU fighting a lean or rich condition?
- Throttle position — How open was the throttle when the code set?
- Intake air temperature (IAT) — Useful for spotting heat-soak issues.
Why does this matter? Because replicating a fault is half the battle. If your freeze frame shows the fault set at 2,400 RPM, 65% engine load, and 88°C coolant temp, you know exactly what driving condition to reproduce on a test drive while monitoring live data. Without freeze frame, you are guessing at conditions and hoping the fault returns.
Freeze frame data also helps you confirm whether a code is actively causing symptoms right now, or whether you are chasing a ghost from a cold morning two weeks ago. Cross-reference it with the information on our most common OBD2 codes guide to quickly understand what the frozen values mean in context.
What Is Live Data? Understanding OBD2 PIDs
Live data — also called real-time data or data stream — is the continuous feed of sensor readings your ECU broadcasts while the engine is running. Each individual measurement is called a PID, which stands for Parameter ID. OBD2 defines a standardized set of PIDs (Mode 01) that any compliant scanner or app can request and receive.
Your scanner sends a request code to the ECU, the ECU responds with a raw hex value, and the scanner converts that into a human-readable number: 14.7:1 air/fuel ratio, 82°C coolant temp, 2,100 RPM. This happens dozens of times per second across multiple PIDs simultaneously.
Not every vehicle broadcasts every PID. Manufacturer-specific PIDs exist beyond the standard Mode 01 set, and some enhanced scanners can access those too. For DIY purposes, the Mode 01 set covers everything you need for the vast majority of faults.
To read live data, you need a scanner or app that supports it. Basic code readers that only display and clear codes will not do. Check our best budget Bluetooth OBD2 adapter page for tools that stream full live data without breaking the bank.
The Key PIDs to Watch — and What Good vs Bad Looks Like
Short-Term and Long-Term Fuel Trims (STFT / LTFT)
Fuel trims are the single most diagnostic PID set available. They tell you exactly how much the ECU is adjusting fueling away from its base map to maintain a stoichiometric air/fuel ratio (14.7:1 for gas).
- STFT (Short-Term Fuel Trim) — A rapid, immediate correction. Expressed as a percentage. Normal range is roughly −10% to +10%, bouncing around 0%. The O2 sensor drives this in closed-loop operation.
- LTFT (Long-Term Fuel Trim) — A learned, slow-moving correction built up over time. This is the ECU admitting “I have to add (or subtract) fuel consistently, so I am baking that into my base corrections.”
The ±10% rule is your benchmark. Both STFT and LTFT should sit within ±10% at idle and light cruise in a healthy engine.
- LTFT of +15% or higher at idle = the ECU is adding fuel = lean condition. Common causes: vacuum leak, weak fuel pump, partially blocked injector, dirty MAF sensor.
- LTFT of −15% or lower = the ECU is pulling fuel = rich condition. Common causes: leaking injector, high fuel pressure, faulty coolant temp sensor reading cold.
- High STFT at idle that corrects at cruise = classic vacuum leak signature. Unmetered air enters below the throttle plate, but at higher RPM the air/fuel ratio catches up.
- High fuel trims that worsen at load / cruise = lean condition under demand, pointing toward fuel delivery (pump, pressure regulator, injectors) rather than a vacuum leak.
O2 Sensor Voltage (Upstream / Bank 1 & Bank 2)
The upstream (pre-cat) oxygen sensor drives fuel trim corrections in closed loop. On a narrowband O2 sensor, voltage should be switching rapidly between approximately 0.1V (lean) and 0.9V (rich), cycling several times per second. A healthy sensor is an impatient one — it cannot sit still.
- Sensor stuck near 0.1–0.2V = ECU sees lean, trims positive. Could be a failing sensor, vacuum leak, or genuine lean fault.
- Sensor stuck near 0.8–0.9V = ECU sees rich, trims negative. Leaking injector or sensor contamination.
- Slow switching (lazy sensor) = the sensor coating is degraded. Even if voltages look right, a slow sensor causes poor fuel control and eventually a P0136/P0141 code.
The downstream (post-cat) sensor should be relatively flat — staying around 0.5–0.7V with little switching. If it mirrors the upstream sensor's activity, the catalyst is no longer doing its job.
MAF Sensor (Mass Airflow, g/s)
The MAF tells the ECU how much air is entering the engine so it can calculate the correct fuel quantity. At idle on a typical 4-cylinder 2.0L engine, you expect roughly 2–7 g/s. At wide-open throttle, that figure climbs to 100+ g/s depending on engine size.
- Low MAF reading at idle + high positive fuel trims = dirty or failing MAF. A contaminated hot-wire element reads low, causing the ECU to add fuel to compensate. Try cleaning the element with MAF cleaner spray before condemning the sensor.
- MAF reading that does not climb with RPM = intake leak between the MAF and throttle body, or a failing sensor.
Coolant Temperature (°C)
The ECT sensor tells the ECU whether to run open-loop (enriched warm-up mode) or closed-loop (stoichiometric fuel control). A healthy engine should reach operating temperature (generally 85–100°C) within 5–10 minutes of cold start, then hold steady.
- ECT stuck below 70°C on a warm engine = thermostat stuck open or a failed sensor reading cold. The ECU stays partially open-loop and runs rich, causing fuel wash on cylinder walls and poor economy.
- ECT that climbs above 105–110°C = cooling system fault. Stop driving and investigate before a head gasket becomes the diagnosis.
Timing Advance (°BTDC)
Timing advance shows how many degrees before top dead center the spark fires. At idle, most engines sit between 5° and 20° BTDC. Under load at cruise, you might see 25–35° or more.
- Timing retarded (low or negative) under load = knock sensor is detecting detonation and pulling timing out. This robs power and points to low-octane fuel, carbon deposits, or a failing knock sensor.
- Timing that does not advance with RPM = ECU is limiting advance, often due to knock events, overheating, or a sensor fault.
Misfire Counters (PID $0131–$0140 / Mode 06)
On most modern vehicles, you can read per-cylinder misfire counts in real time. The ECU increments a counter each time it detects a crankshaft deceleration event consistent with a misfire on a specific cylinder. This is invaluable for isolating a P0300 (random misfire) to a specific cylinder without guesswork.
- One cylinder accumulating misfires rapidly = coil, plug, injector, or compression fault on that cylinder. Swap the coil with an adjacent cylinder and re-read to confirm.
- Multiple cylinders misfiring at idle, clearing at cruise = vacuum leak or IAC fault affecting overall idle stability rather than a single-cylinder mechanical issue.
Using Live Data to Diagnose a P0171 (System Lean, Bank 1)
Here is how freeze frame and live data combine in a real diagnosis. You retrieve a P0171 and check freeze frame: LTFT was at +18% when the code set, engine at idle, fully warm. That tells you the lean condition is worst at idle — vacuum leak territory.
You connect the scanner and open live data. You watch STFT bounce between +10% and +20% at idle. LTFT is sitting at +16%. MAF is reading 3.8 g/s on a 2.4L engine — a little on the low side. You spray carburetor cleaner (carefully) around intake manifold gaskets while watching STFT. When you hit a crack in the gasket near cylinder 3, STFT immediately drops toward 0% as the engine stumbles slightly. You found the vacuum leak — confirmed without removing a single part prematurely.
That is the workflow: freeze frame narrows the condition, live data narrows the cause, and systematic testing closes the case. For step-by-step instructions on what comes next once you have confirmed the fault, see our guide on how to clear a code correctly.
Graphing and Logging Live Data
Reading PIDs as numbers on a screen works at idle, but graphing turns live data into a proper diagnostic tool. When you plot STFT, LTFT, and MAF on a time-series graph during a test drive, patterns emerge that numbers alone hide. A fuel trim spike at exactly 2,200 RPM every time you accelerate becomes obvious on a graph. A momentary MAF dropout that lasts 0.3 seconds shows up as a cliff edge in the trace.
Most Android OBD2 apps (Torque Pro, Car Scanner ELT, OBD Fusion) support graphing and CSV logging. On iOS, OBD Fusion and Car Scanner offer the same. Log a 10–15 minute drive that reproduces the symptom, then review the data at your workbench. This is how professional technicians confirm intermittent faults that never show up during a workshop idle check.
Bluetooth adapters based on the ELM327 v1.5 or OBDLink chipset handle multi-PID streaming well. Cheap clones often drop PIDs or introduce latency that distorts graphs — another reason to pick your adapter carefully before trusting the data. Our OBD2 adapter buying guide covers which chipsets to trust.
Putting It All Together
Freeze frame stops being a footnote and starts being your first diagnostic move. Before you touch a wrench, pull the freeze frame, note the operating conditions when the fault set, then replicate those conditions while streaming live data. Watch fuel trims for the lean/rich signature. Watch the O2 sensor for activity and switching speed. Watch the MAF for low readings. Watch timing for knock retard. Let the engine tell you where the fault is before you start replacing parts.
This approach separates the technicians who fix cars from the ones who replace parts until the light goes off. The data is there — your scanner just needs to be capable of reading it, and you need to know what the numbers mean. Now you do.
For a broader overview of how fault codes are structured and what all the mode indicators mean, return to the Reading OBD2 Codes hub.
Recommended Products

Best for the best budget dongle for live data and freeze frame
- Fast, secure Bluetooth
- Deep OEM & full live data
- Works iOS & Android
- No battery drain
Why buy it: the most capable budget dongle — fast, secure and deep enough to stream every PID and freeze frame record without dropouts.

Best for cheap iOS + Android live data
- BLE for iOS & Android
- Wide app support (Car Scanner, OBD Fusion)
- Tiny and cheap
Why buy it: a cheap dongle that streams Mode 01 live data and Mode 02 freeze frame on both iOS and Android.

Best for Android users on a budget
- Rock-solid on Android with Torque Pro
- Huge review track record
- Very cheap
Why buy it: the long-proven cheap pick for Android phones running Torque Pro's graphing and logging.

Best for plain-English code explanations
- Plain-English code meanings
- Maintenance reminders
- Very simple app
Why buy it: translates codes into plain English for total beginners, though its app shows less raw live data than the enthusiast picks.
Best for the tightest budget
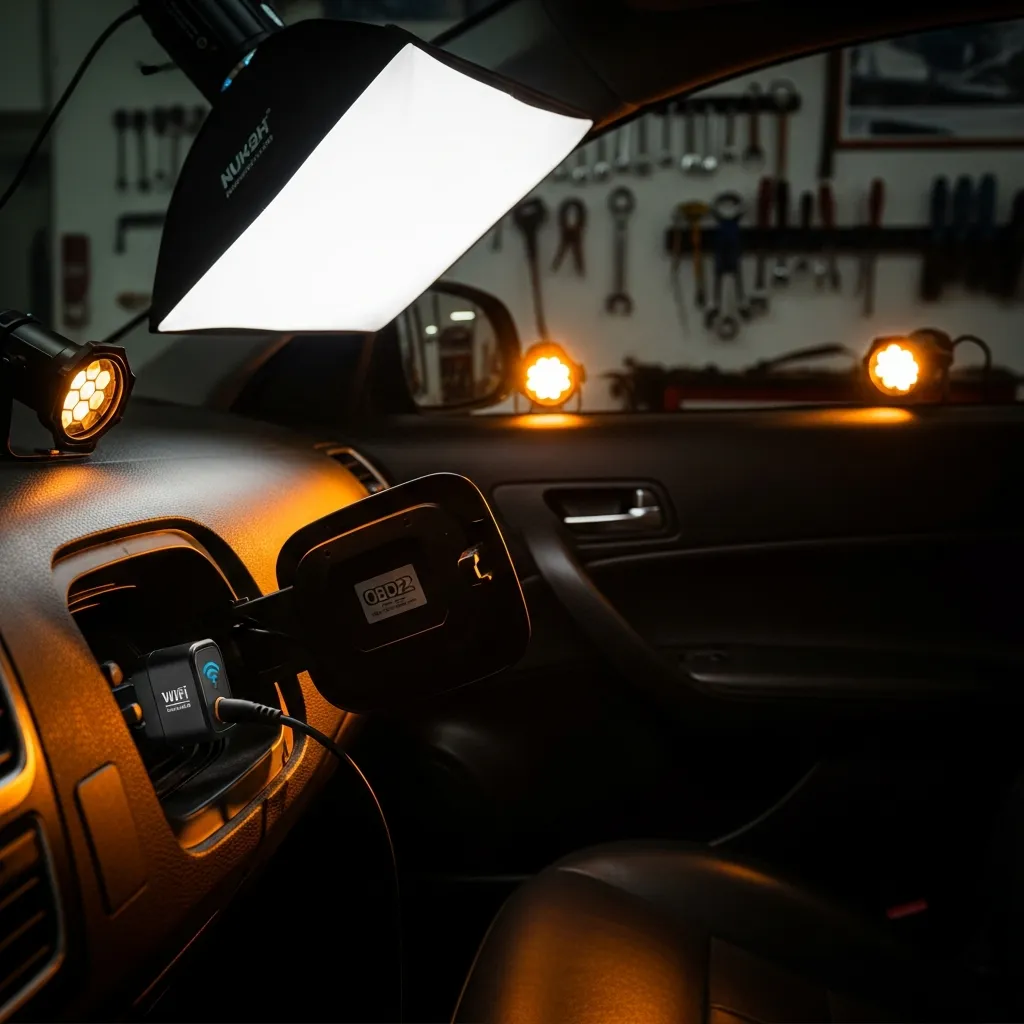
- WiFi (great for iOS)
- Tiny and cheap
- Reads codes plus basic live data
Why buy it: the cheapest way onto your phone — fine for reading codes and basic PIDs, if not the fastest for graphing.
Prices are pulled from Amazon and were accurate as of Aug 22, 2026, 6:54 PM EDT. Product prices and availability are subject to change — the live price is shown on Amazon.